
|
Event Log |
The Event Log records informational messages, warnings, and errors generated by the application and synchronized devices, allowing operators to monitor system behavior, troubleshoot issues, and review historical activity. The Event Log is automatically updated as events occur and remains available across application sessions.
To investigate events that occurred on a device when the software was not connected, individual device logs can be downloaded directly from devices using NetSetter.
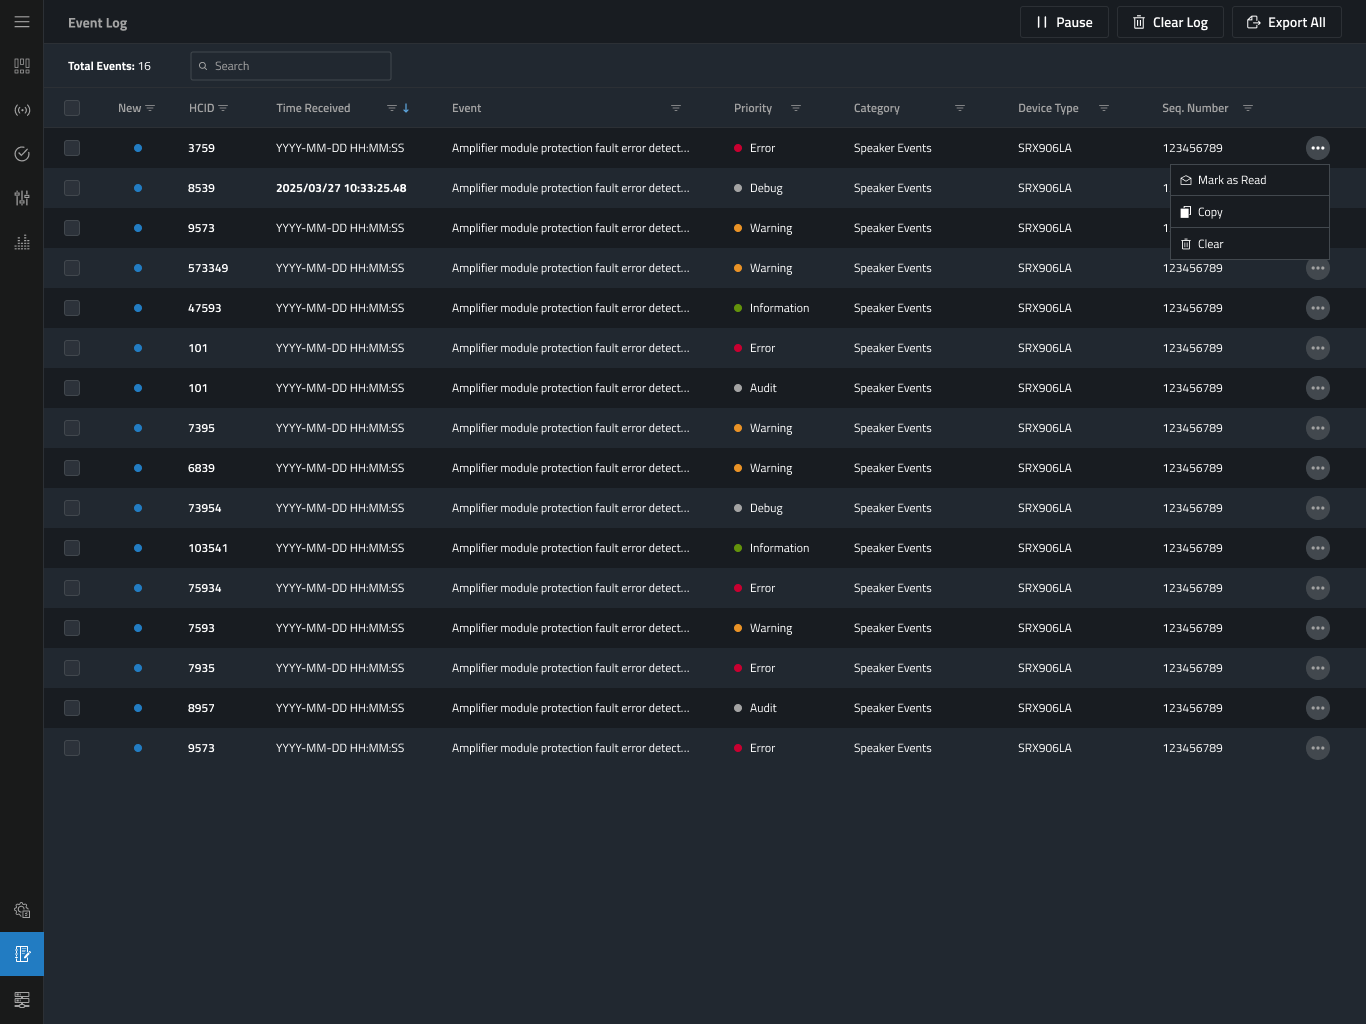
Event Log Controls
| Button | Action |
|---|---|

|
Pressing Pause suspends the creation of new log items. This can be done to make finding an existing event easier or to stop the log function. |

|
Pressing resume re-enables the logging function. |

|
Clears all events currently stored in the Event Log. |

|
Exports all events currently stored in the Event Log as a .csv. Useful when a file can be sent with lots of data for analysis with a spreadsheet viewer or AI. |
Event Log Categories

By default, events are displayed in chronological order they are received, with the newest events appearing first. They can come from the application or any connected and subscribed device. By default only Warnings and Errors are shown but Audit, Debug and Information level events can be exposed.
|
Column |
Description |
|---|---|
| New | This will show a new indicator  for all events not marked as "Read". selecting the row or multi-selecting rows and clicking "Mark as Read" will clear this indicator. for all events not marked as "Read". selecting the row or multi-selecting rows and clicking "Mark as Read" will clear this indicator. |
| HCID | This is the device the Event was reported by. |
| Time Received | Each event will log the time Performance received the message. Many devices do not have real-time clocks and only report Sequence numbers. this serves as a way to index events in a timed order. |
| Event | This is the description of the event. This may contain codes used by customer support or engineering to further refine what may be going on |
| Priority |
Events are assigned a priority as:
|
| Category | What generated the event. |
| Device Type | Device typel that generated the event. |
| Sequence Number | Generated by the device at the time of the event, this help determine the order of events in devices without real-time clocks or events that occur very quickly. |
| Menu | For each row: Mark as read, Copy as CSV data, Clear |
 Filtering and Sorting

Each column includes a menu for filtering and sorting its contents. For example, the log can be filtered by device, date range, or event type to focus on specific events or reduce the number of displayed entries. Applied filters appear in the filter row and can be removed by clicking the X next to each filter. By default, only Errors and Warnings are displayed. When a column has an active filter, its filter icon turns blue  .
.
Row Menu
A Menu at the end of each row item provides options for individual entries:

| Button | Action |
|---|---|

|
Will mark the selected entry as read and remove the indicating the entry was unread. |

|
Selecting Copy will copy the row to the clipboard. Useful for a text message or quick email. |
|
|
Selecting Clear will delete the row from the log. |
Multi Select
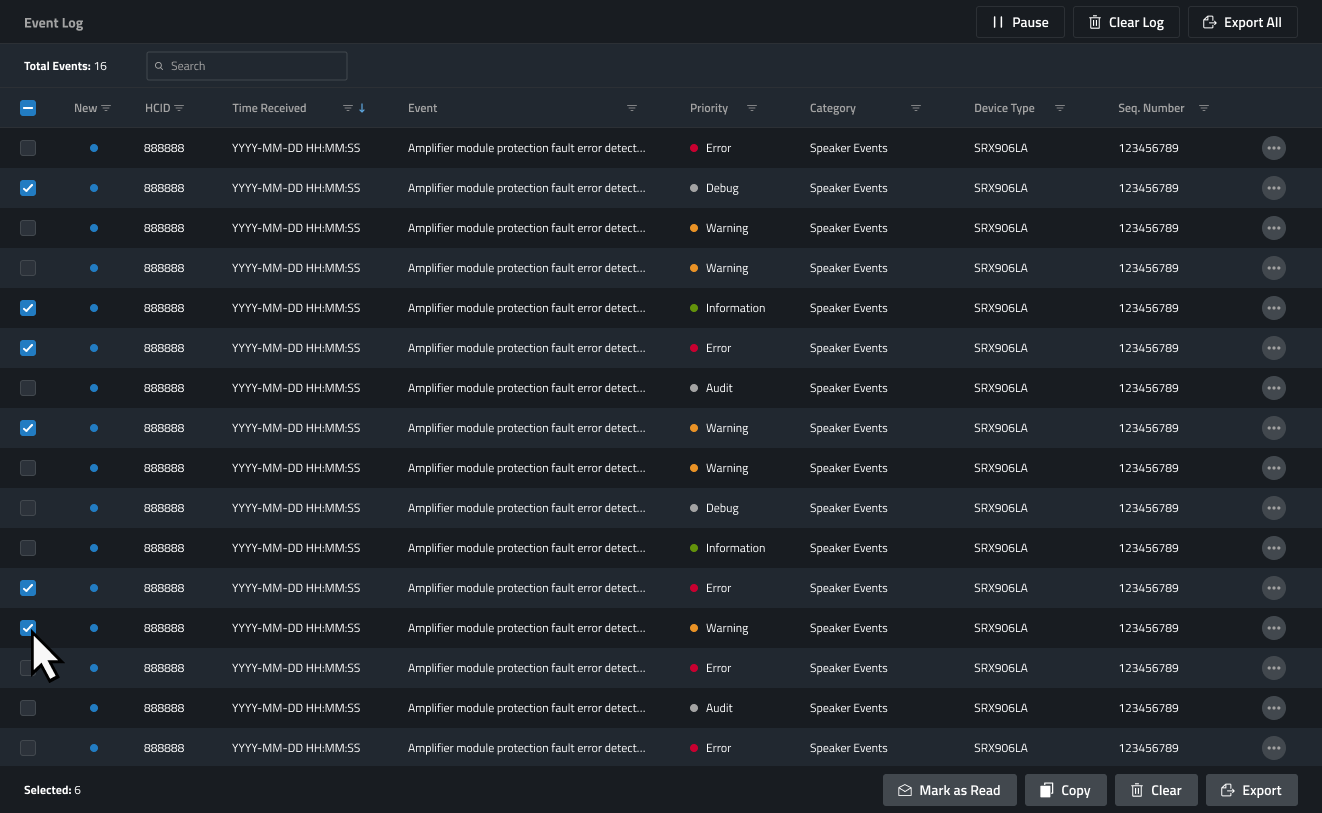
Select multiple Event Log entries for simultaneous action using the  check box on the left edge of each entry. With any entries selected the Multi Select menu will be revealed at the bottom of the Event Log window.
| Button | Action |
|---|---|

|
Will mark all selected rows as read and remove the indicating the entry was unread. |

|
Selecting Copy will copy all selected rows to the clipboard. |

|
Selecting Clear will delete all selected rows from the log. |

|
Exports all selected row entries. |
